You will now be redirected to the GD3 website
Genesis Drug Discovery & Development is a proud member of Genesis Drug Discovery & Development (GD3), a fully integrated CRO providing services to support drug discovery programs of our clients from target discovery through IND filing and managing Phase I-III clinical trials.
Learn more about GD3Biochemistry & Bioanalytical

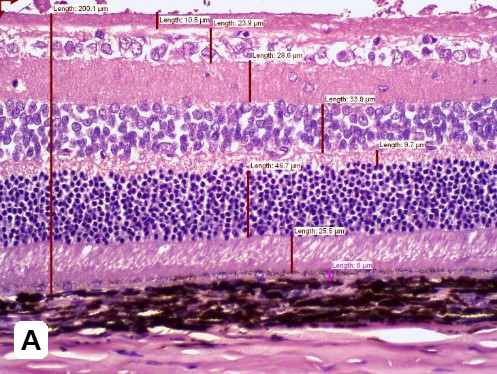
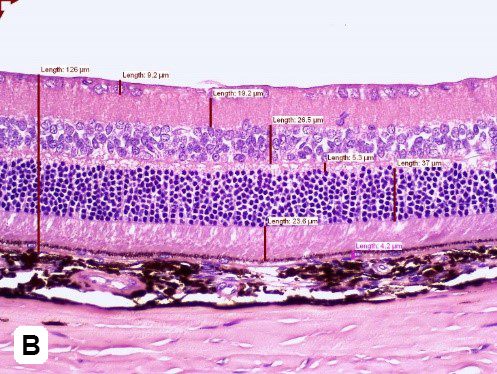
Diabetic-Induced Retinopathy
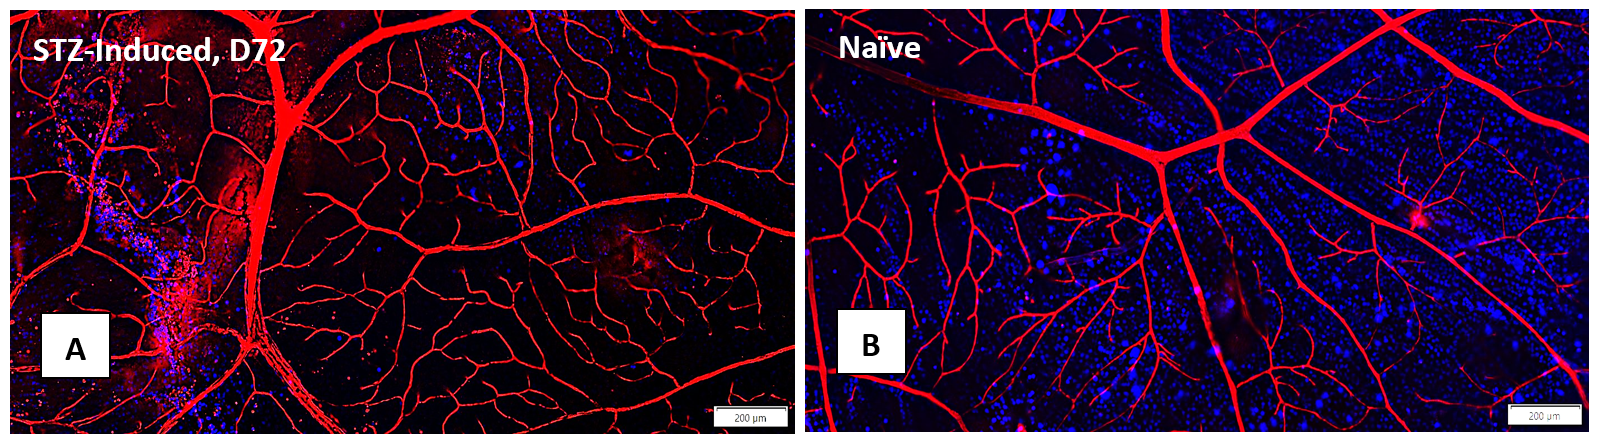
Elevated blood sugar levels, or hyperglycemia, trigger a cascade of detrimental effects, including oxidative stress, endothelial cell damage, and capillary occlusion. This leads to tissue hypoperfusion, elevated Vascular Endothelial Growth Factor (VEGF) levels, neovascularization, and complications like leakage and retinal edema in Diabetic Retinopathy (DR)1. Developing an animal model that accurately replicates the pathogenesis and endpoints of DR is essential for effectively evaluating potential therapeutics at various disease stages.
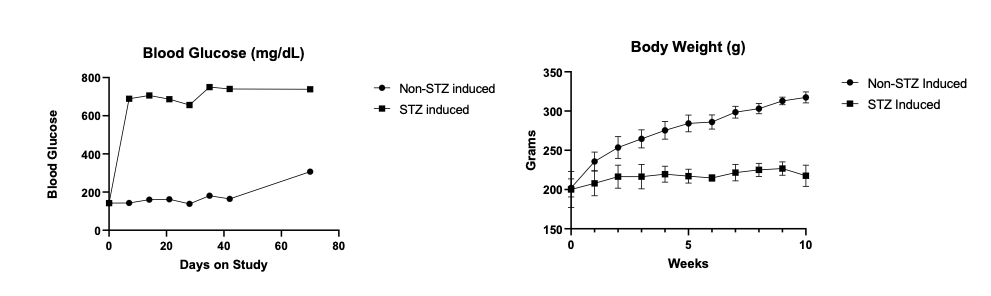
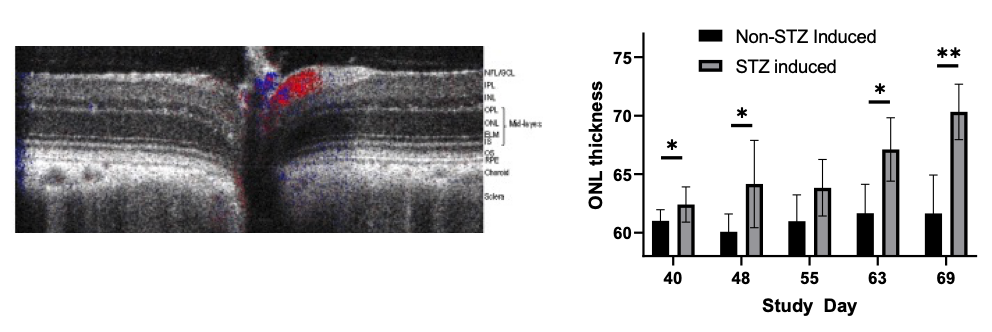
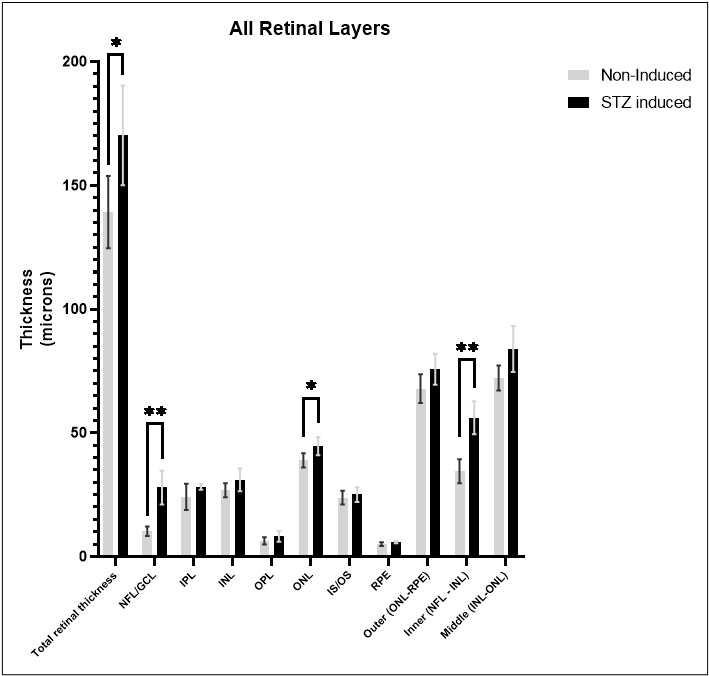
GD3 specializes in comprehensive DR studies, utilizing validated methods to evaluate disease progression and therapeutic interventions. Our model involves inducing diabetes through a single injection of Streptozotocin, causing disruption and loss of pancreatic beta cells followed by sustained hyperglycemia2. This allows for longitudinal clinical observation as DR evolves. We have designed and validated a robust set of endpoints tailored to assess DR, accommodating diverse sponsor requirements and budgets.
| Animal Species | Brown Norway Rat |
| Method of Induction | A single intraperitoneal injection of Streptozotocin |
| Follow up Period | Typically, it takes 4-10 weeks for diabetic retinopathy to develop, followed by a variable amount of time depending on the desired disease stage. |
| Route of intervention | Intravitreally or systemic |
| Readouts |
|
Reference:
- 1. Wang W, Lo ACY. Diabetic Retinopathy: Pathophysiology and Treatments. Int J Mol Sci. 2018 Jun 20;19(6):1816. doi: 10.3390/ijms19061816. PMID: 29925789; PMCID: PMC6032159.
- 2. Olivares AM, Althoff K, Chen GF, Wu S, Morrisson MA, DeAngelis MM, Haider N. Animal Models of Diabetic Retinopathy. Curr Diab Rep. 2017 Aug 24;17(10):93. doi: 10.1007/s11892-017-0913-0. PMID: 28836097; PMCID: PMC5569142.
Learn more about