You will now be redirected to the GD3 website
Genesis Drug Discovery & Development is a proud member of Genesis Drug Discovery & Development (GD3), a fully integrated CRO providing services to support drug discovery programs of our clients from target discovery through IND filing and managing Phase I-III clinical trials.
Learn more about GD3Biochemistry & Bioanalytical

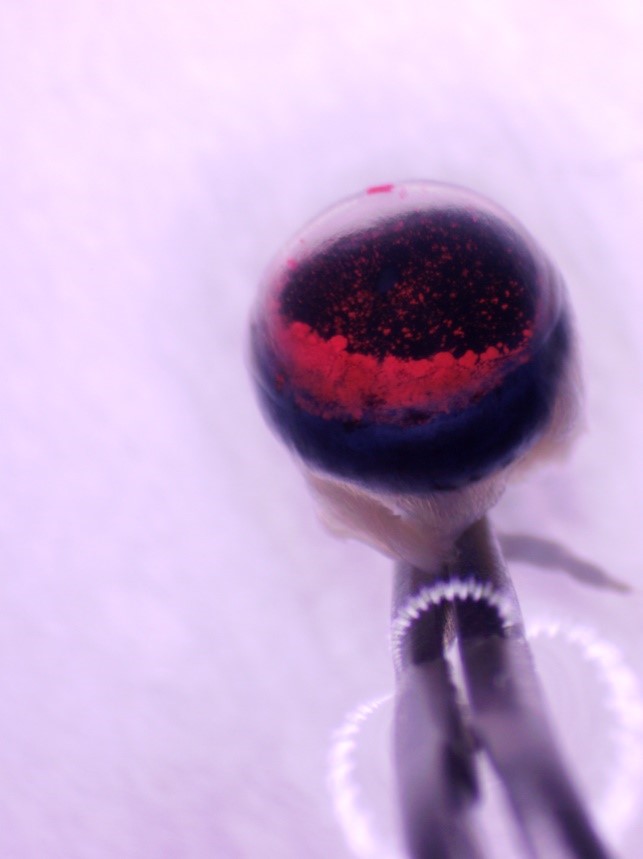
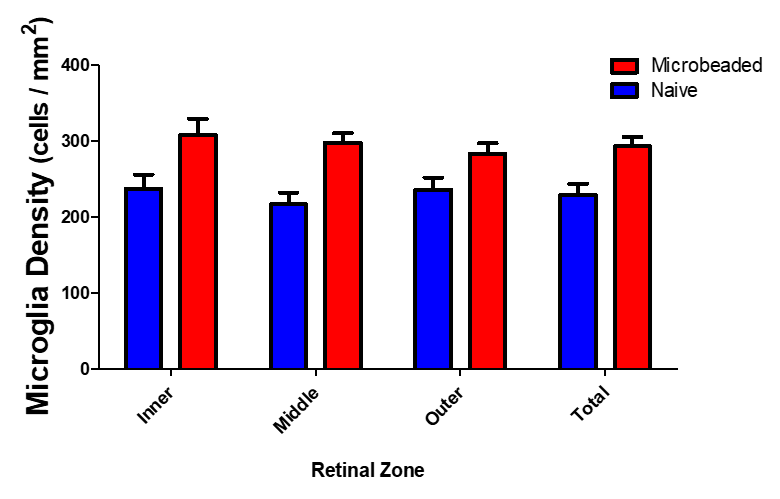
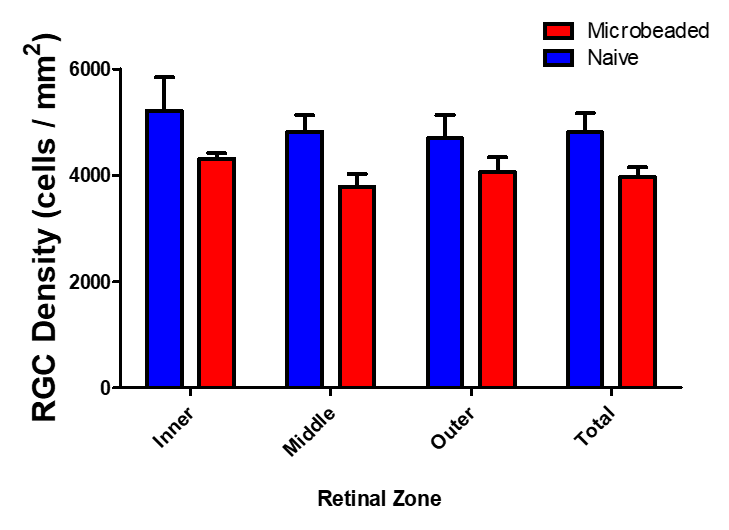
Microbead Model of Occlusion
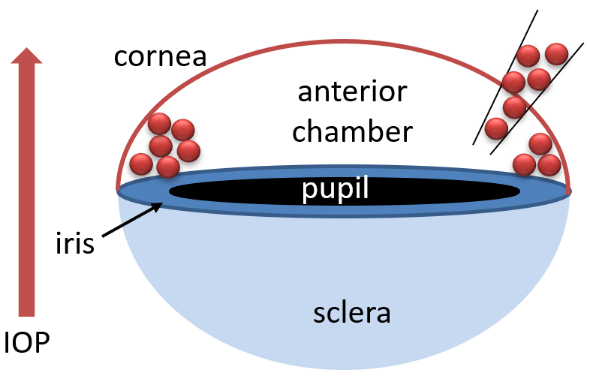
Intraocular pressure (IOP) is highly regulated and can result in the development of glaucoma, uveitis, and retinal detachment when disturbed.1 This important equilibrium of pressure is maintained through the production and drainage of aqueous humor through the trabecular meshwork (TM). The microbead occlusion model involves the administration of microbeads into the anterior chamber with pinpoint accuracy, which blocks the drainage channels within the TM. Successful blockage and elevated IOP are monitored and confirmed through a variety of advanced ocular imaging and data collection techniques. This data, combined with our biomarker analysis capabilities, can be used to better understand the effectiveness of various therapeutic candidates.
| Animal Species | Mouse |
| Method of Induction | Administration of polystyrene microspheres (10-15 μm) into anterior chamber |
| Follow up Period | 4-6 Weeks |
| Route of intervention | Intravitreal, intracameral, topical, systemic |
| Readouts |
|
Reference:
- Machiele R, Motlagh M, Patel BC. Intraocular Pressure. [Updated 2022 Jul 11]. In: StatPearls [Internet]. Treasure Island (FL): StatPearls Publishing; 2024 Jan-. Available from: https://www.ncbi.nlm.nih.gov/books/NBK532237/
Learn more about